The Bronx has a place where aging boomers can remember what it was like to watch living things grow.
EXEMPTION
On November 19, 2010, the Securities and Exchange Commission (SEC) issued proposed rules relating to provisions of the Dodd-Frank Act that expand the SEC’s regulatory authority over investment advisers to include many more investment advisers to private equity and hedge funds, subject to certain exemptions.
Later, a non-U.S. investment adviser went to the SEC’s Division of Investment Management to get a Foreign Private Adviser Exemption, as described in the Dodd-Frank Act.
This is the story of that investment adviser.
Merger of egos
“Newsweek Daily Beast”— chronologically incoherent (like a monthly yearbook) but at least the print title comes first.
Memo to Mort Zuckerman: save your magazine and follow Sidney Harman’s self-abasing example — “U.S. News & Drudge Report” would be perfect.
Buy more and be happy
You are a true believer. Blessings of the state. Blessings of the masses. Thou art a subject of the divine. Created in the image of man, by man, for man. Let us be thankful we have commerce. Buy more. Buy more now. Buy more and be happy.
Short of direct stimulus spending, a payroll tax holiday — at least with respect to the employee’s portion of Social Security and Medicare taxes — looks like the best, fastest and most politically feasible way to put money into the hands of people who will actually use it to buy more. A holiday on the employer’s portion of payroll taxes, albeit a necessary (if not sufficient) condition for Republican support, is going to be less effective stimulus. To the extent the employee’s portion gets spent, the increase in aggregate demand is likely to have a greater impact on hiring decisions than the reduction in employers’ cost per employee.
Let us be thankful we have an occupation to fill. Work hard, increase production, prevent accidents, and be happy.
Either way, of course, a tax cut that actually works to stimulate the economy is the last thing the Republicans want. Republican congressmen will accuse Obama of raiding the Social Security and Medicare trust funds so he can buy free lunches for illegal immigrants and build a mosque in your home town, and New York Post readers will believe. Republican advisors will argue that only regressive tax cuts create jobs, and Fox News Channel viewers will believe. Republican lobbyists will say that because a payroll tax holiday is only temporary, it results in more “regime uncertainty” and further undermines business confidence, and Wall Street Journal readers will believe. And all the true believers will know, on some level, that two more years of slow-or-no growth and high unemployment is the key to Republican hopes in 2012.
For more enjoyment and greater efficiency, consumption is being standardized.
Shrinking the size of government
Would a 1:1000 scale model of conservative aspirations look any more realistic than Paul Ryan’s roadmap?
Top-heavy
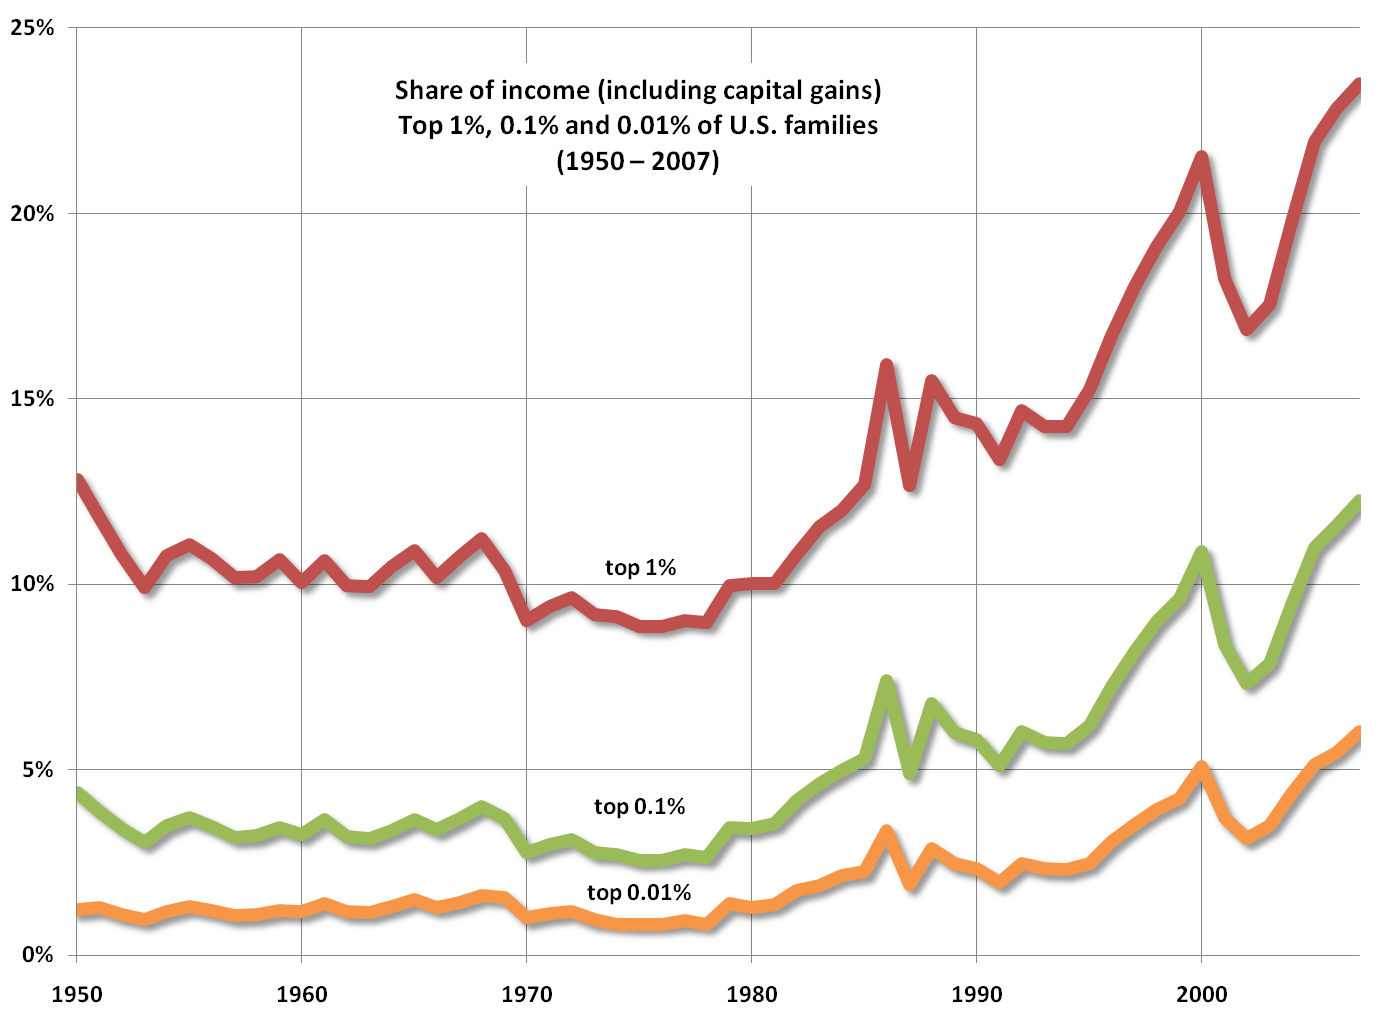
What the income-inequality denialists and “politics of envy” critics don’t want to see: pre-tax income and wage data compiled by Thomas Piketty (Paris School of Economics/EHESS) and Emmanuel Saez (Department of Economics, UC Berkeley, Director, Center for Equitable Growth, 2009 John Bates Clark medal winner).
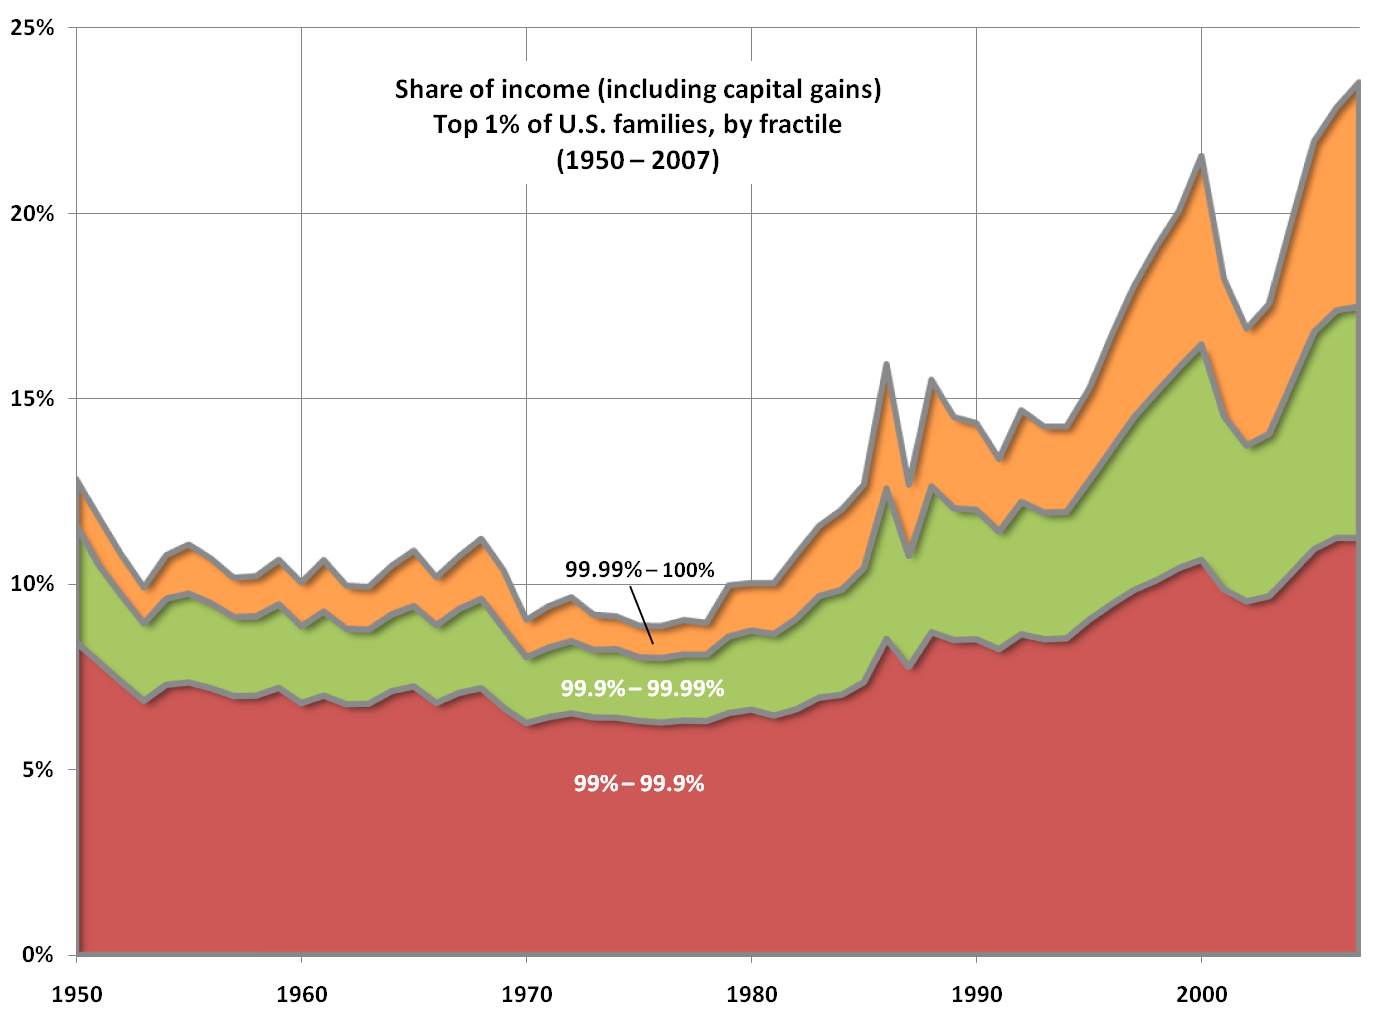
From which data we’ve created a few visual displays of income concentration among the top 1% of U.S. families (the “merely rich”), the top 0.1% of U.S. families (the “very rich”) and the top 0.01% of U.S. families (the “filthy rich”) from 1950 to 2007. Headlines for 2007:
- The merely rich — 1,498,750 families with incomes of at least $398,900 — had a 23.50% share of all U.S. family income.
- The very rich — 149,875 families with incomes of at least $2,053,000 — had a 12.28% share of all U.S. family income.
- The filthy rich — 14,988 families with incomes of at least $11,477,000 — had a 6.04% share of all U.S. family income.
The income shares of the merely, very and filthy rich in 2007 were all much, much larger than they were in 1950 — 12.82%, 4.39% and 1.22%, respectively. Compared to the previous secular peak for income concentration in the late 1920’s, the 2007 income share of the merely rich was just shy of the 23.94% record set in 1928. The 2007 income shares of the very and filthy rich, however, were well in excess of the previous highs (also set in 1928) of 11.54% and 5.02%, respectively.
If the increase from 1950 to 2007 in the income share of the merely rich was remarkable, the increase in the income share of the very rich was truly exceptional and, as for the filthy rich … un-fucking-believable:
- From a 12.82% income share for the merely rich in 1950 to a 23.50% share in 2007 — an increase of 83%.
- From a 4.39% income share for the very rich in 1950 to a 12.28% share in 2007 — an increase of 180%.
- From a 1.22% income share for the filthy rich in 1950 to a 6.04% share in 2007 — an increase of 395%!
Looked at another way, the increase from 1950 to 2007 in the share of U.S. family income going to the top 1% as a whole was mainly attributable to increases in the income shares going to the very and filthy rich:
- The income share of the top 1%, excluding the filthy rich (i.e., the 99%–99.99% fractile), increased only 51% from 1950 to 2007.
- The income share of the top 1%, excluding the very along with the filthy rich (i.e., the 99%–99.9% fractile), increased only 33% from 1950 to 2007.
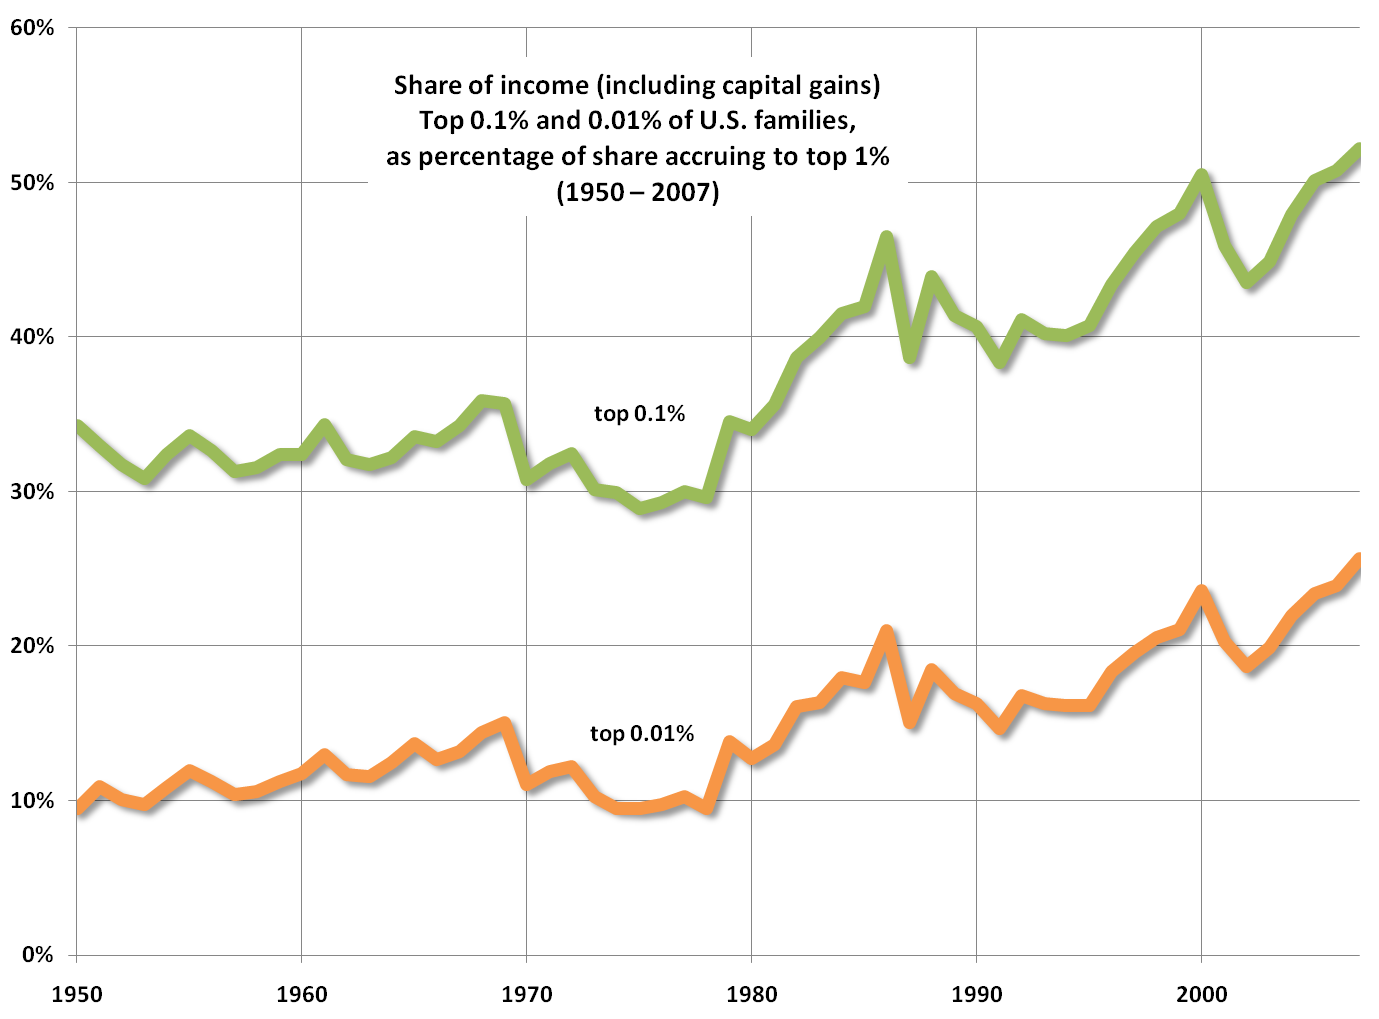
The accelerating growth of income concentration within the top 1% is evidence of nothing less than the emergence, especially since the 1980s, of an income plutocracy in the United States:
- As a percentage of the income going to the top 1.0% of U.S. families, the share of the very rich increased from 34.25% in 1950 to 52.23% in 2007.
- As a percentage of the income going to the top 1.0% of U.S. families, the share of the filthy rich increased from 9.52% in 1950 to 25.68% in 2007.
Pitching the counterinsurgency
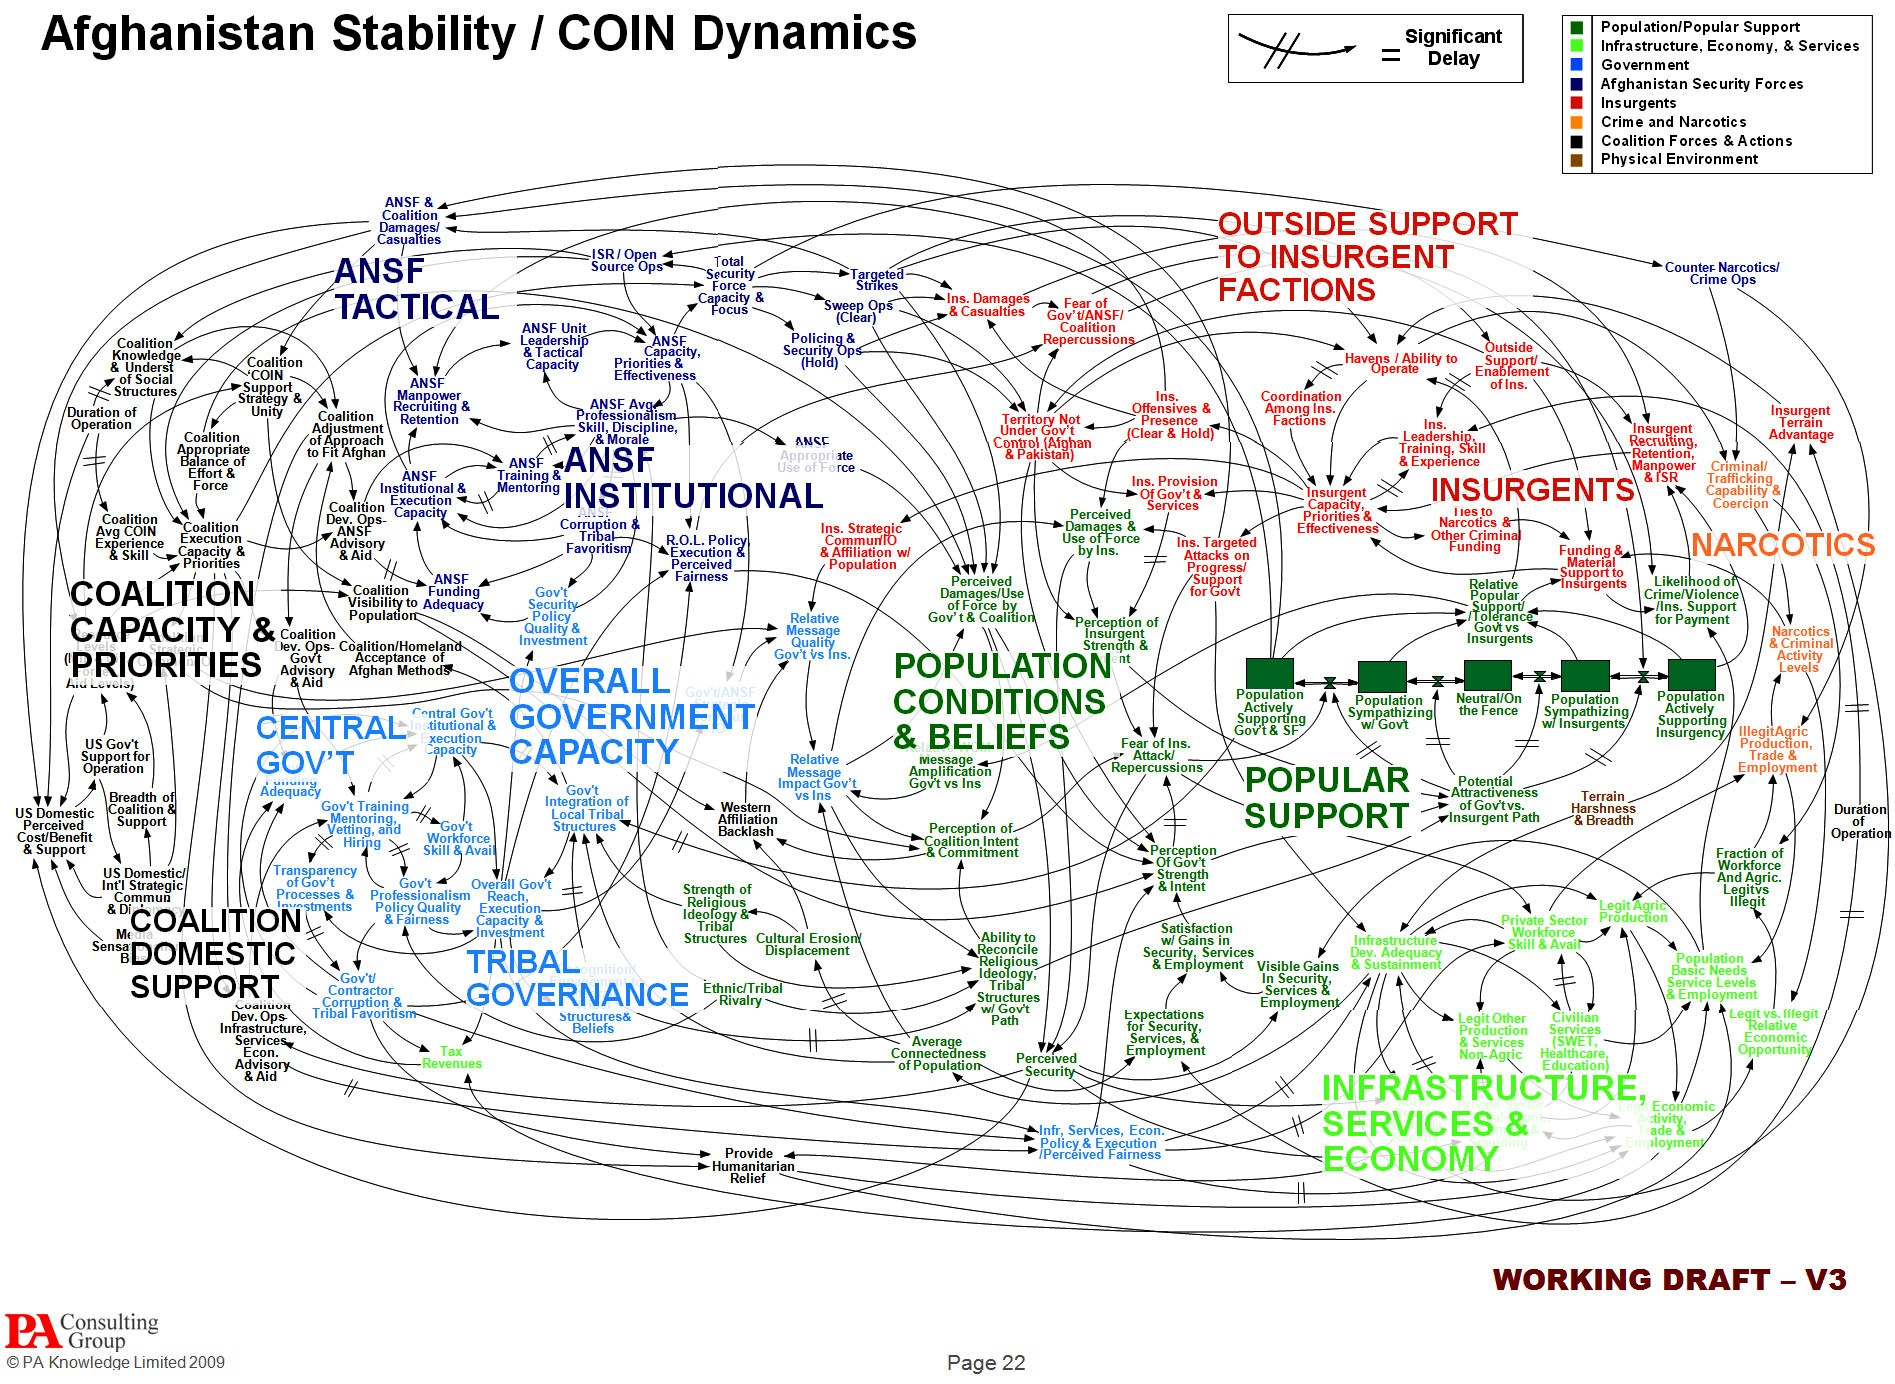
From today’s paper, the U.S. counterinsurgency strategy in Afghanistan reduced to meaningless chartjunk:
As if Edward Tufte’s diagnosis of the state of our verbal and statistical reasoning in the era of PowerPoint — “Power corrupts; PowerPoint corrupts absolutely” — needed any confirmation.
Make sentences, not bullet points.


